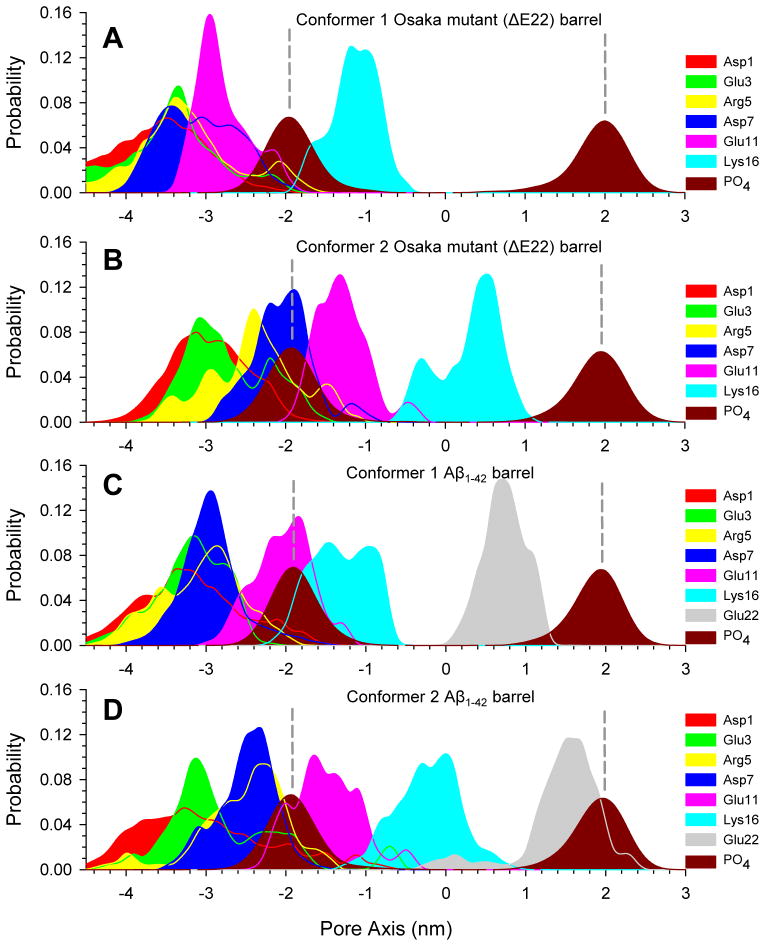
Figure 7.
Probability distribution functions for selected charged residues, Asp1 (red), Glu3 (green), Arg5 (yellow), Asp7 (blue), Glu11 (pink), Lys16 (cyan), and Glu22 (gray), and for the phosphate group of lipid head, PO4 (dark red), as a function of the distance along the pore center axis for the (A) conformer 1 and (B) conformer 2 Osaka mutant (ΔE22) barrels, and the (C) conformer 1 and (D) conformer 2 Aβ1–42 barrels.

