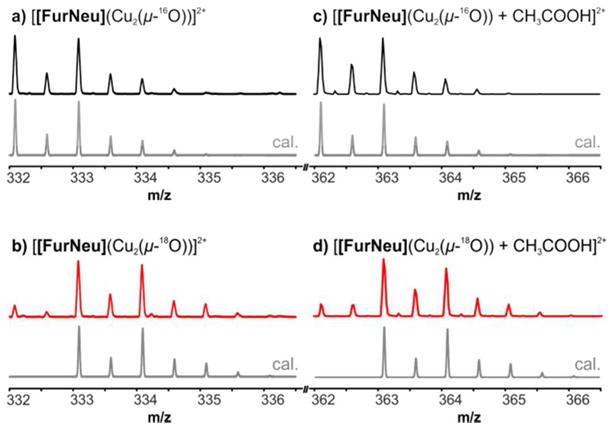
Figure 5.

Characteristic peaks in the HR-ESI mass spectra of solutions of [FurNeu](Cu2(μ-16O))(OTf)2, 5 (black lines), and [FurNeu](Cu2(μ-18O))(OTf)2, 518O (red lines), respectively, in acetonitrile. Signals of the corresponding dications [[FurNeu](Cu2(μ-16/18O))]2+ and [[FurNeu](Cu2(μ-16/18O)) + CH3COOH]2+ were also observed after the reaction of 3 with both 16O2 (18O2) and PhI16O (PhI18O). The grey lines represent the calculated peak patterns. For clarity reasons the intensities of the signals shown were equalized. The full spectra are given in the SI (Figure S13 and S14).
