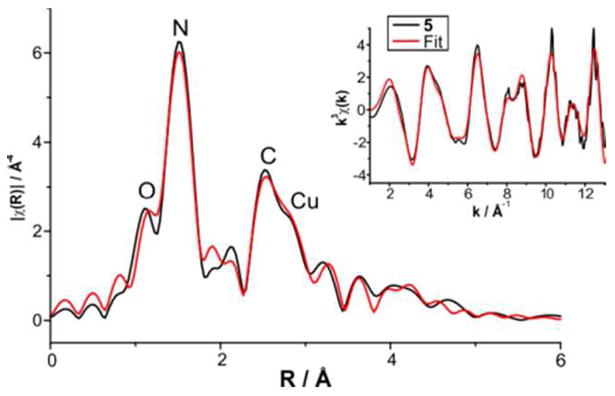
Figure 7.

Overlay of the k3 weighted EXAFS of 5 and the best fit (No. 8 in Table S2, SI) in R and k space, respectively. Main figure: Black line shows the Fourier transformed EXAFS data and the red line represents the best fit (No. 8 in Table S2, SI) in R space. Inset: Black line shows the weighted RAW data and the red line the back-Fourier transformed fit (range R = 2-13 Å) in k space.
