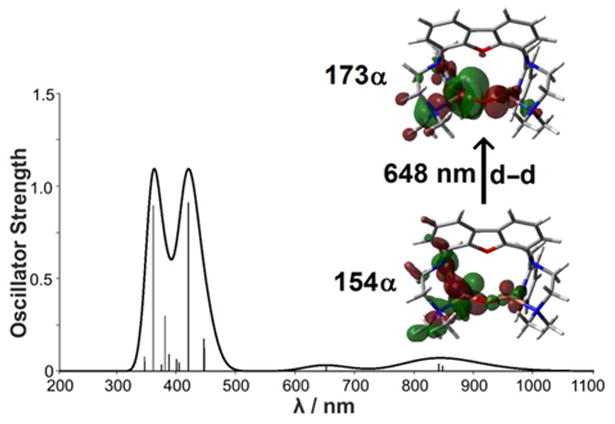
Figure 9.

Calculated absorption spectra for 5 using TDDFT at the CAM-B3LYP/def2-TZVP level (compare experimental spectrum, Figure 3 (blue line) and Figure S5 (SI, green line), respectively. The molecular orbitals involved in leading excitations for the transition at 648 nm are also shown (see also Table S6 in the SI for a detailed analysis of the other main transitions). The thicker line represents the Gaussian-broadened spectrum with s = 900 cm-1.
