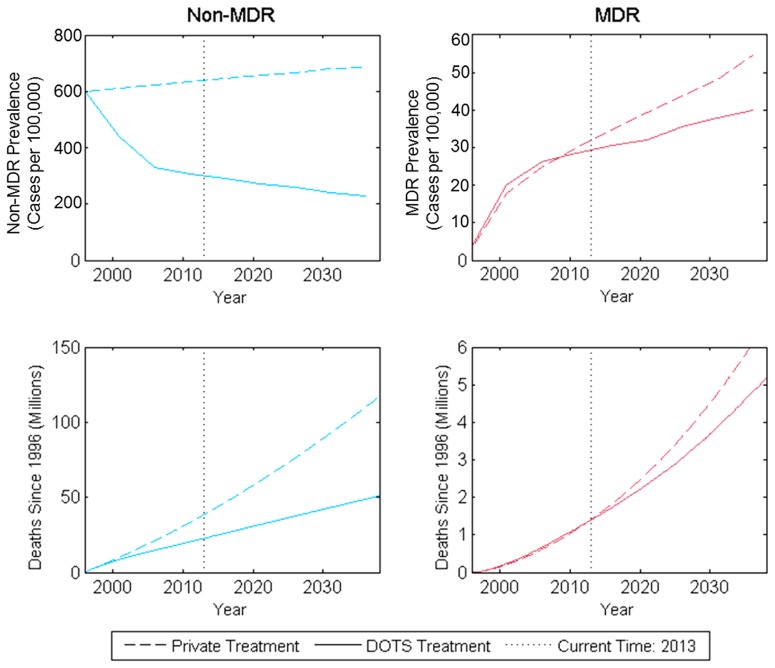
Figure 3. Projected prevalence and mortality from non-MDR and MDR TB in India with public DOTS treatment programs and counterfactual private treatment expansion in the absence of public treatment.
Figure shows model estimations and projections of disease prevalence and deaths after 1996, when public nationwide TB treatment in India began. Private treatment curves (dashed lines) represent outcomes in a scenario where DOTS was never implemented and private clinic population coverage increased to half of the level that DOTS currently covers. Solid lines represent disease prevalence and deaths given observed public treatment levels in India and assume public TB treatment will continue at current levels.

