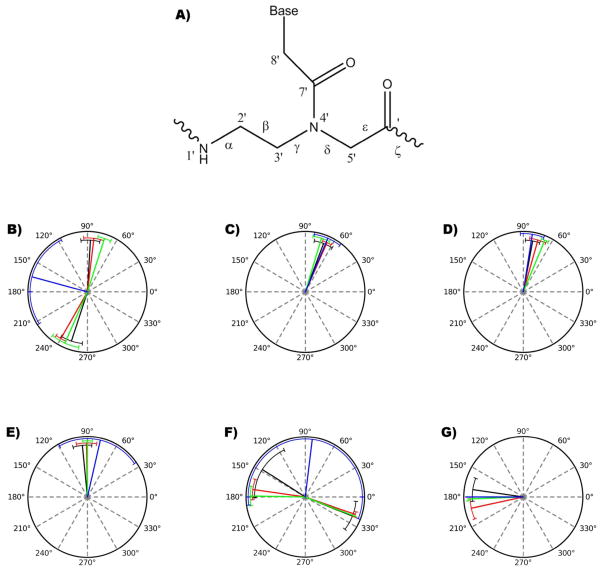
Figure 3. Backbone angles of PNA from MD simulations.
A) Lewis structure of a PNA monomer and the corresponding backbone angles. Average values were measured over 25.0 ns of simulation and compared to average values from available PNA-RNA/DNA structures. Polar plots for backbone angles were constructed, the black lines represents the angle measured from simulation, red a PNA-PNA duplex (PDB ID: 1PUP), green a PNA-DNA duplex (PDB ID: 1NR8) and blue a PNA-RNA duplex (PDB ID:176D). Circular plots represent the B) alpha, C) beta, D) gamma, E) delta, G) epsilon and F) zeta angle values. Error bars represent standard deviation of each base pair in a duplex.

