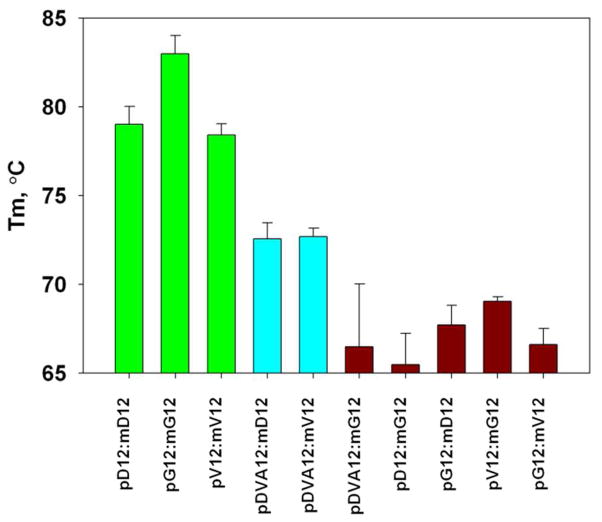
Figure 5. Melting temperatures of RNA-DNA duplexes.
CD thermal ramps from 25°C to 95°C were monitored at the peak wavelength, 265 nm. Tms calculated from first derivative peaks are shown with error bars corresponding to the standard deviation from 3 independent measurements. Holm-Sidak All Pairwise Multiple Comparison revealed statistically significant differences (p<0.001) among group 1, the complementary duplexes (green), group 2, the hypoxanthine-adenine and hypoxanthine-uracil duplexes (cyan), and group 3, hypoxanthine-guanine and mismatch duplexes (magenta).

