Figure 4.
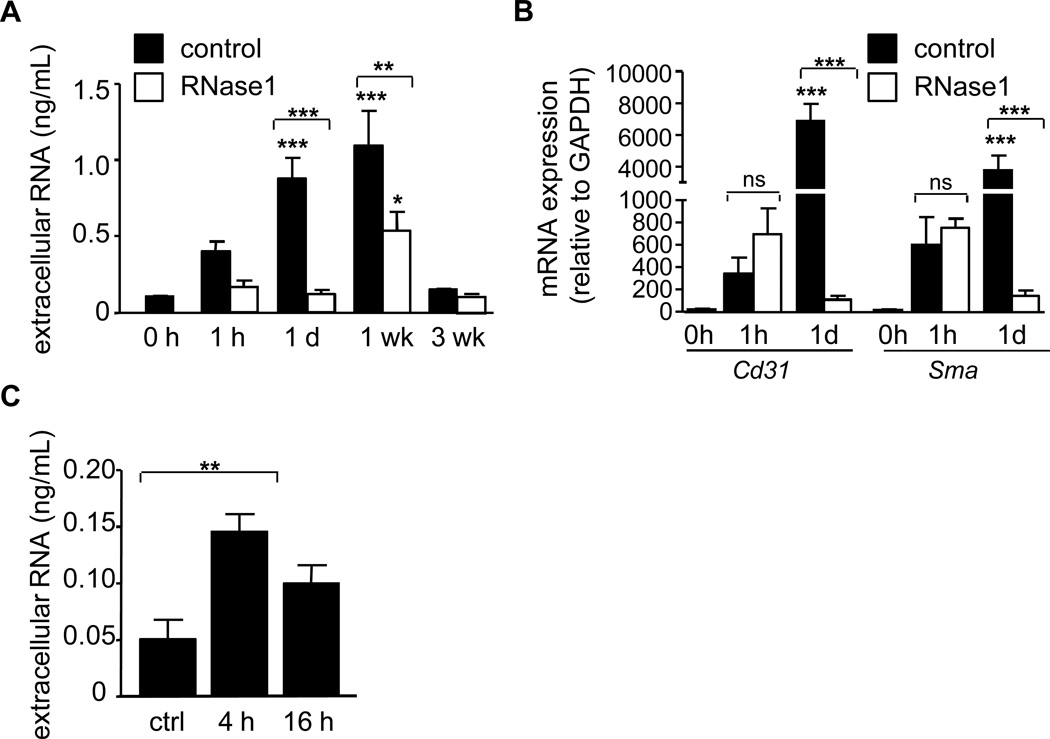
eRNA increases after vascular injury. (A) The concentration of eRNA in plasma of apoE−/− mice before injury (0 h) and at indicated time points after arterial injury was measured in the control (filled bars) and the RNase1-treatment group (open bars). Values are expressed as mean ± SEM (n=7 per group). *p<0.05, **p<0.01, ***p<0.001 vs. 0h control, or as indicated. (B) mRNA detection for Cd31 (endothelial cells) and α-smooth muscle actin (Sma, smooth muscle cells) in plasma before injury (0h), at 1 h and 1 day after injury (n=4–5 per group) was quantified by real-time PCR in the control (filled bars) and RNase1-treatment group (open bars). Values are expressed as mean ± SEM; *p<0.05, **p<0.01, and ***p<0.001 vs. 0h, or as indicated; ns=non-significant. (C) Extracellular RNA concentration was measured in supernatants of SMC activated with TNF-α for 4 h or 16 h. Values represent mean ± SEM (n=6 per group); *p<0.05.

