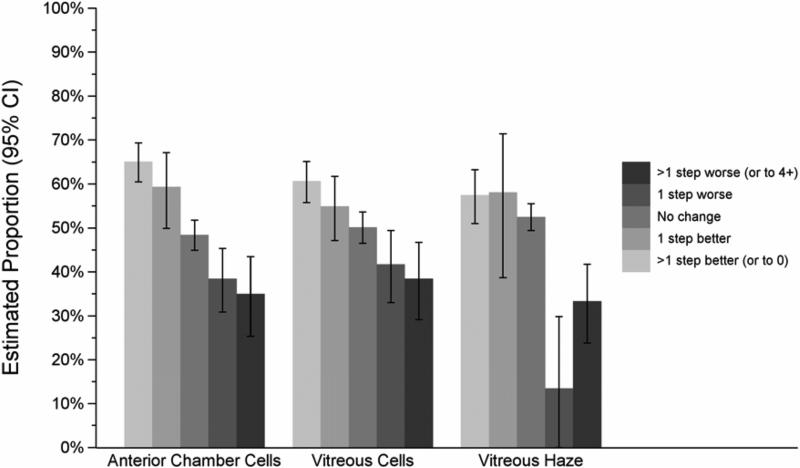
Figure 4.
Influence of the change in uveitis activity over six months on the proportion of eyes with macular edema causing visual acuity to worse than 20/40 that gained at least two lines’ improvement in visual acuity by that time. Error bars denote 95% confidence intervals. p<0.01 comparing degrees of step-wise improvements within each category of uveitis activity. CI = confidence interval

