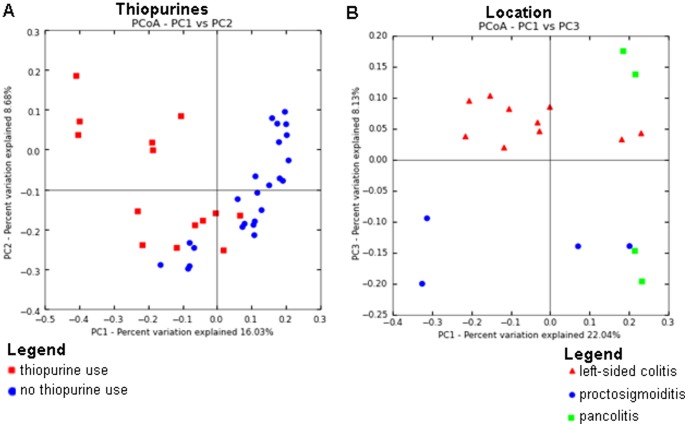
Figure 3. Communities clustered using Principal Coordinates Analysis (PCoA) of the unweighted UniFrac distance matrix.
(A) PC1 and PC2 are plotted on x- and y-axes. Each point corresponds to a community colored according to thiopurine use. All samples are shown. The percentage of variation explained by the plotted principal coordinates is indicated on the axes. (B) PC1 and PC3 are plotted on x- and y-axis. Each point corresponds to a community colored according to disease location. Only samples from UC patients are included.

