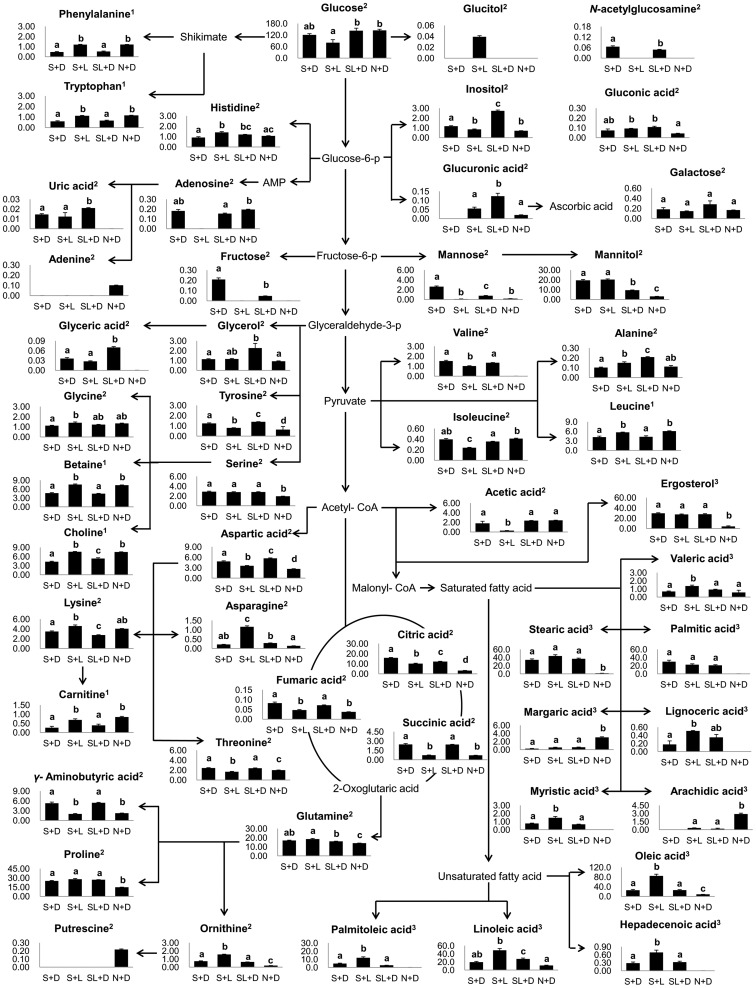
Figure 4. Schematic diagram of the metabolic pathway and relative levels of the major compounds detected in C. pruinosa extracted with 70% MeOH and 100% n-hexane plus D2O.
This was modified from pathways presented in KEGG database (http://www.genome.jp/kegg/). ANOVA was performed to assess the statistical significance of differences between samples (p<0.05). Data are mean values with error bars representing standard deviation values. Different letters in bars represent the difference of statistical significance of metabolites levels. The superscript numbers in compounds represent analysis methods. 1: NMR analysis of D2O extracts, 2: GC-MS analysis of 70% methanol extracts, 3: GC-MS analysis of n-hexane extracts.

