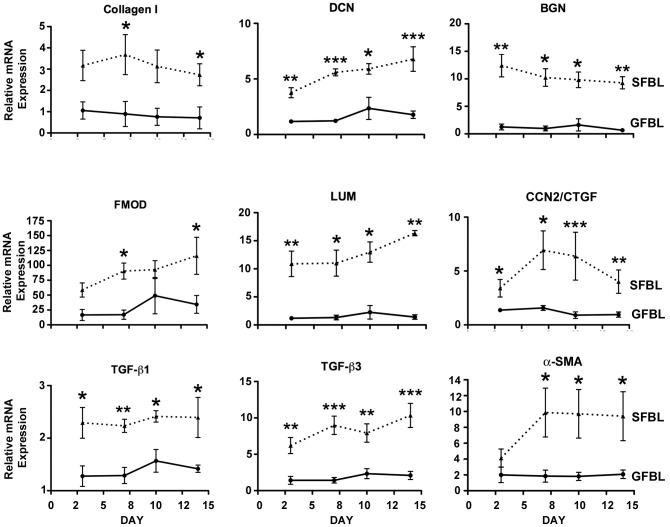
Figure 8. Tissue-specific gene expression is stable over time in 3D cultures.
Results show mean +/− SEM of relative mRNA expression from five parallel GFBL and breast SFBL lines from different donors, and were calculated relative to one GFBL line. Statistically comparison performed between GFBLs and SFBLs at each time point are shown (*p<0.05, **p<0.01, ***p<0.001; Student's t-test and two-way ANOVA). DCN: Decorin; BGN: Biglycan; FMOD: Fibromodulin; LUM: Lumican; CCN2/CTGF: Connective Tissue Growth Factor; α-SMA: α-Smooth Muscle Actin.

