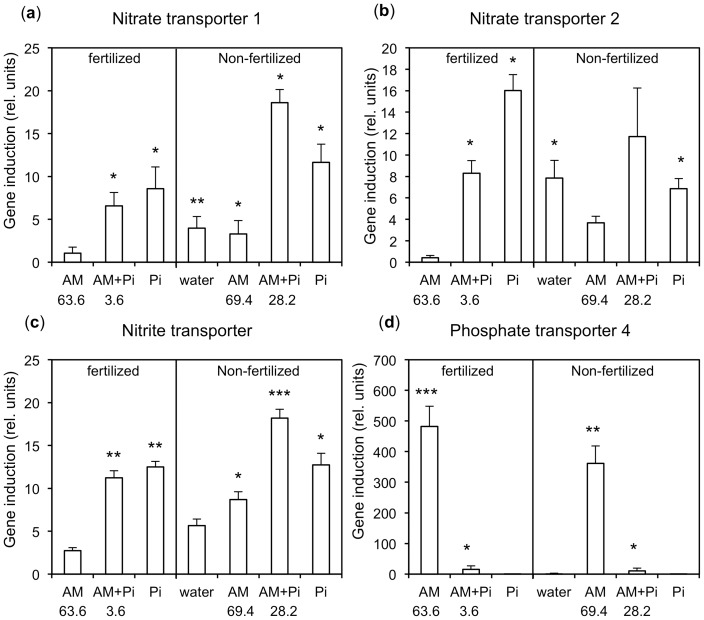
Figure 8. Quantitative real time PCR analysis (qPCR) of marker genes for nitrogen and phosphorus acquisition.
qPCR analysis was performed to determine the expression of the N transporters boxed in Figure 7, and of the AM-specific phosphate transporter PhPT4. Treatments were as in Figures 3–6 and Table 1. Expression values were first normalized to GAPDH and then expressed as induction ratios for the indicated treatments relative to the standard treatment (non-mycorrhizal fertilized plants), as in Table 1. Columns represent the mean of five biological replicates. Error bars represent the standard deviations derived from the two standard deviations of the compared treatments (see Materials and Methods). Numbers below the x-axis reflect the percentage of root colonization in the respective sample.

