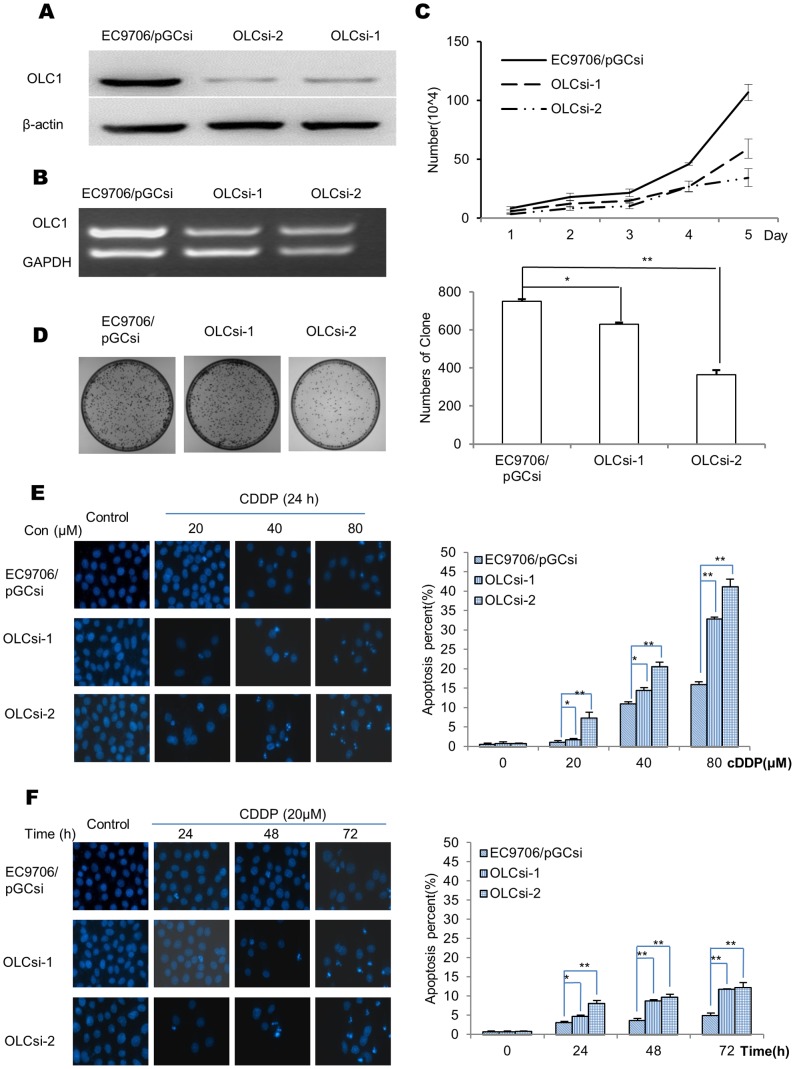
Figure 4. OLC1-interfering cell lines and their differential effects on cell growth and apoptosis in response to CDDP treatment.
(A) EC9706 cells were transfected with PGCsi-U6/neo/GFP-control or PGCsi-U6/neo/GFP-OLC1. The 2 stable OLC1-interferencing cell lines and paired control were verified by western blotting, and named OLCsi-1, OLCsi-2 and EC9706/pGCsi, respectively. (B) Evaluation of the mRNA levels of OLC1 in OLCsi-1, OLCsi-2 and EC9706/pGCsi cells, assessed by RT-PCR. (C) The cell proliferation curve was calculated from cell counting data over 5 days. (D) Graph showing the total numbers of colonies of OLCsi-1, OLCsi-2 and EC9706/pGCsi cells. (E) OLCsi-1, OLCsi-2 and EC9706/pGCsi cells were treated with CDDP at concentrations of 0, 20, 40, 80 µM for 24 h, and apoptosis was assessed by DAPI staining. The graph shows the percent of apoptotic cells from each cell line. Significance was determined by the Student’s t test. * = P<0.05; ** = P<0.001.

