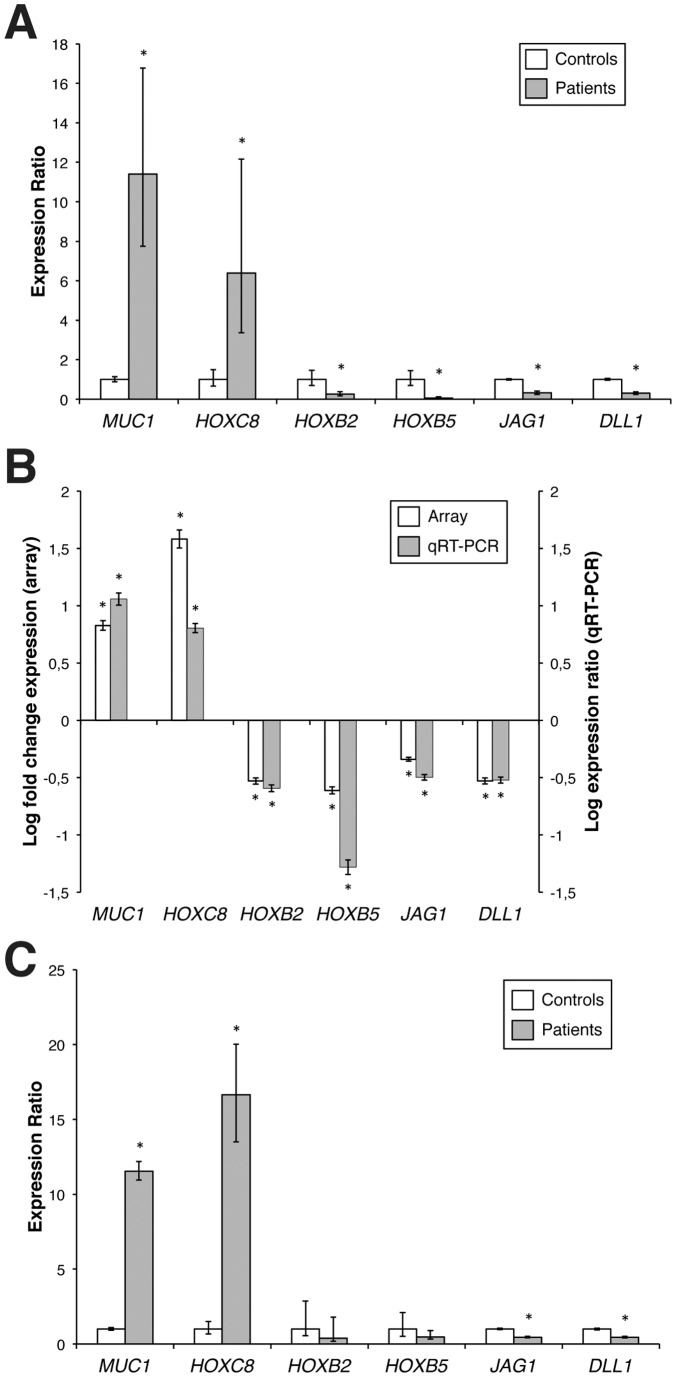
Figure 2. Validation of differential gene expression by Quantitative Real Time PCR.
A) qRT-PCR analysis of mRNA expression levels of the six selected genes in the eight patients subjected to microarray analysis. For each gene, relative mRNA levels of patients are shown as fold value of the levels of five healthy subjects (controls). Each experiment was performed in triplicate, and mRNA levels were normalized to GAPDH mRNA expression. Error bars represent standard deviations (*P<0.01). B) Expression of selected genes in MRKHS patients compared to controls, tested by microarray analysis (left, white columns) and qRT-PCR (right, grey columns). Array data are shown as log fold change of patients divided by controls, qRT-PCR data are shown as log expression ratio of patients divided by controls. Bars indicate the measurement error (*P<0.01). C) qRT-PCR analysis of mRNA expression levels of the genes of interest in sixteen MRKHS patients. For each gene, relative mRNA levels of patients are shown as fold value of the levels of five healthy subjects (controls). Each experiment was performed in triplicate, and mRNA levels were normalized to GAPDH mRNA expression. Error bars represent standard deviations (*P<0.01).

