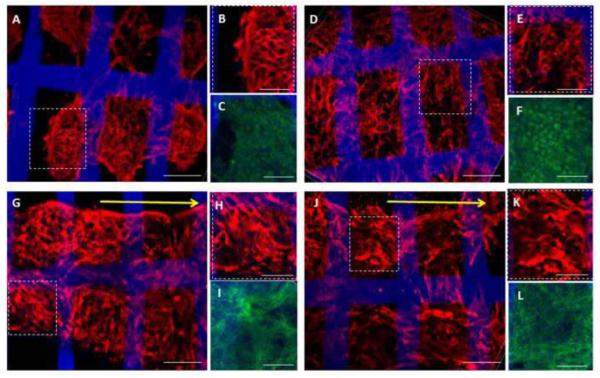
Figure 3.
Protein expression and tissue morphologies for (A–C) group (i), (D–F) group (ii), (G–I) group (iii), and (J–L) group (iv). Confocal images of 8-day constructs showed expression of the cardiac-specific marker Tn-T (A, B, D, E, G, H, J, K) and the cytoskeletal marker F-Actin (C, F, I, L) in all four groups. ES was associated with the formation of tissue-like bundles oriented in parallel to the direction of the electric field in groups (iii and iv) (G,J). Yellow arrows point in the direction of the electrical field. Tn-T: red; F-actin: green; PGS scaffold: blue. Regions of interest (dashed boxes) within full-stack confocal renderings (A, D, G, J) are also shown at higher magnification as partial stack (10-layer) confocal renderings (B, E, H, K). Scale bars: (A, D, G, J) 100 μm; (B, C, E, F, H, I, K, L) 50 μm.

