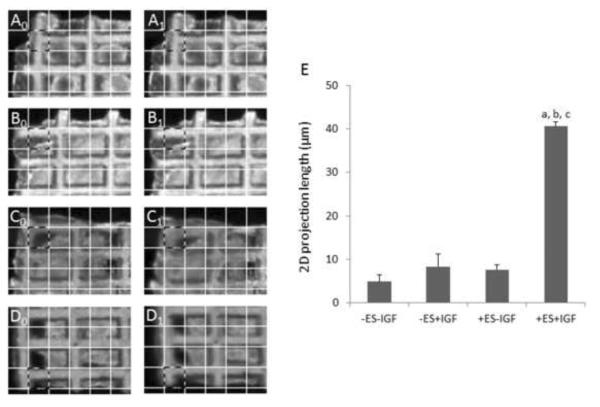
Figure 8.
2D projection length. Representative images of relaxed and contracted constructs used to calculate 2D projection lengths for (A0,A1) group (i), (B0,B1) group (ii), (C0,C1) group (iii), and (D0,D1) group (iv). Corresponding regions of interest for relaxed (X0) and contracted (X1) constructs (e.g., A0 and A1, respectively) are outlined in a dashed pattern, where each grid square shown has dimensions of 120 m × 120 μm. Calculations were made from these images using an automated image processing algorithm, but qualitative differences can be noted by eye using grid squares as a reference. (E) Summary of 2D projection lengths for 8-day constructs, where data are the mean ± SE of at least 6 samples, and (a) indicates individual effect of IGF (p=0.0002), (b) indicates interactive effect of ES and IGF (p=0.0002), and (c) indicates individual effect of ES (p=0.0002).

