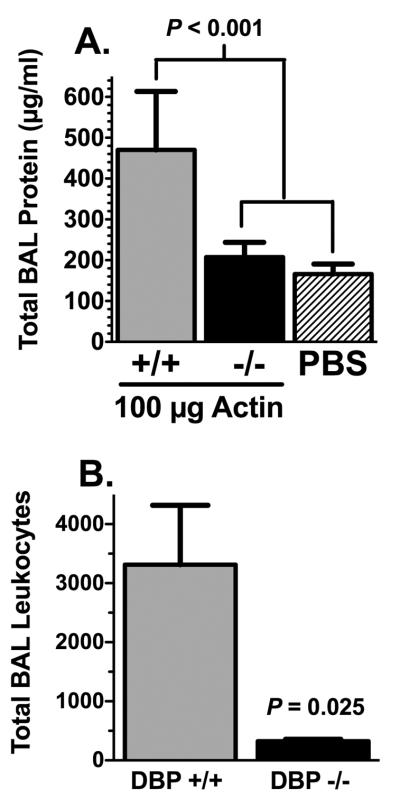
Figure 4.

Analysis of total protein and leukocytes in BAL 4 hours after actin injection. (A) Total protein content of cell-free BAL fluid from actin injected DBP+/+ mice (n = 6), actin injected DBP−/− mice (n = 7) and PBS injected mice (n = 5). Statistical significance is indicated. (B) Total BAL leukocytes from actin injected DBP+/+ and DBP−/− mice (n = 5). Numbers represent mean ± SEM, statistical significance is indicated.
