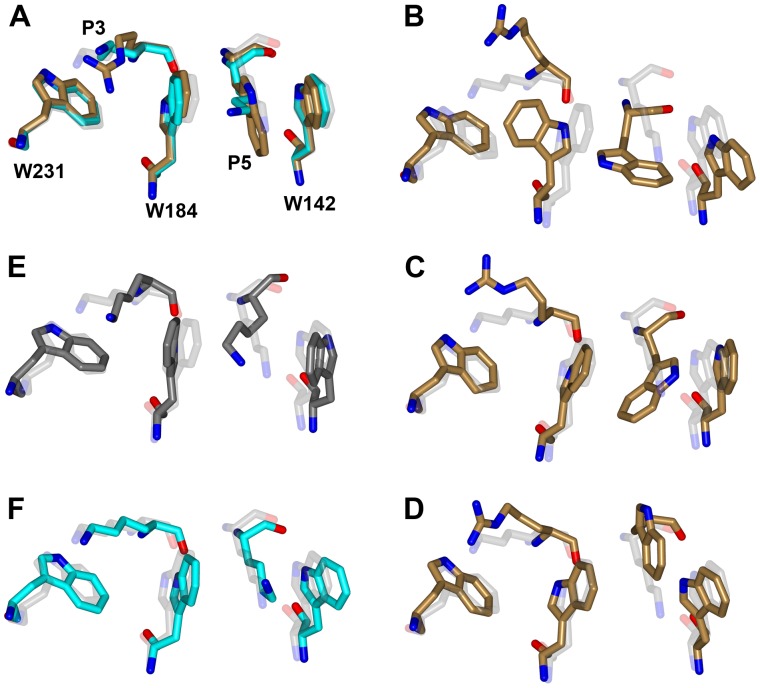
Figure 4. Unrestrained MD simulations of NSL3 and SV40Tag modeled into the major site of importin α.
Conformations of five residues are shown to indicate whether the modeled structures are stable. Shown with carbon in light gray, cyan, and sand are the crystal (PDB entry 1EJL) and modeled structures for SV40Tag and the modeled structure for NLS3, respectively. (A) The models at the start of simulations. (B)–(D) Snapshots from three repeat simulations of the NLS3 model, at 0.85, 1.85, and 1.85 ns, respectively. (E) Snapshot from a simulation of 1EJL at 20 ns, shown in dark gray. (F) Snapshot from a simulation of the SV40Tag model at 20 ns.

