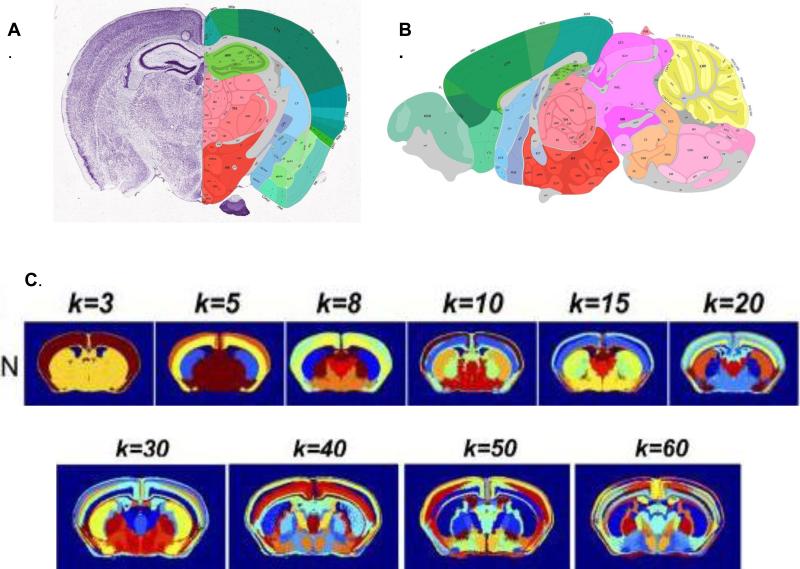
Fig 2.
Spatial clustering of neuron-specific transcripts delineates anatomical boundaries in the brain, revealing more than 50 brain regions. The spatial resolution and delineation of brain-structures increases as then number of k-mean clusters of neuron-specific transcripts used in the analysis increases. Further refinement of c ell types and their projection may increase anatomical resolution. A. Coronal section from Allen Brain Reference Atlas. B. Sagital section from Allen Brain Atlas. C. Spatial cluster analysis of neuron-specific transcripts. Adapted with permission9.

