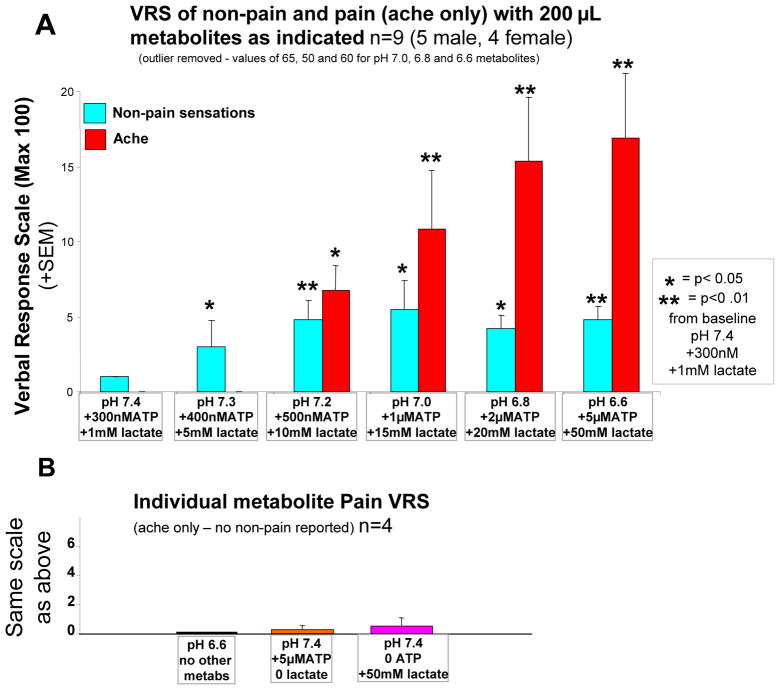
Figure 3.
A, average of verbal reports of amount of non-pain and pain sensations with combinations of metabolites as indicated (n=9, 5 male 4 female). One subject (male) was removed because of VRS scores for non-pain sensations 10 times greater than any other subjects for the highest 3 metabolite infusions. B, average verbal reports of amount of pain sensations caused by 200 μL infusions of individual metabolites indicated below each bar (n=4, 2 male, 2 female).
* P<.05, ** P<.01 increase from baseline -- paired T-test.

