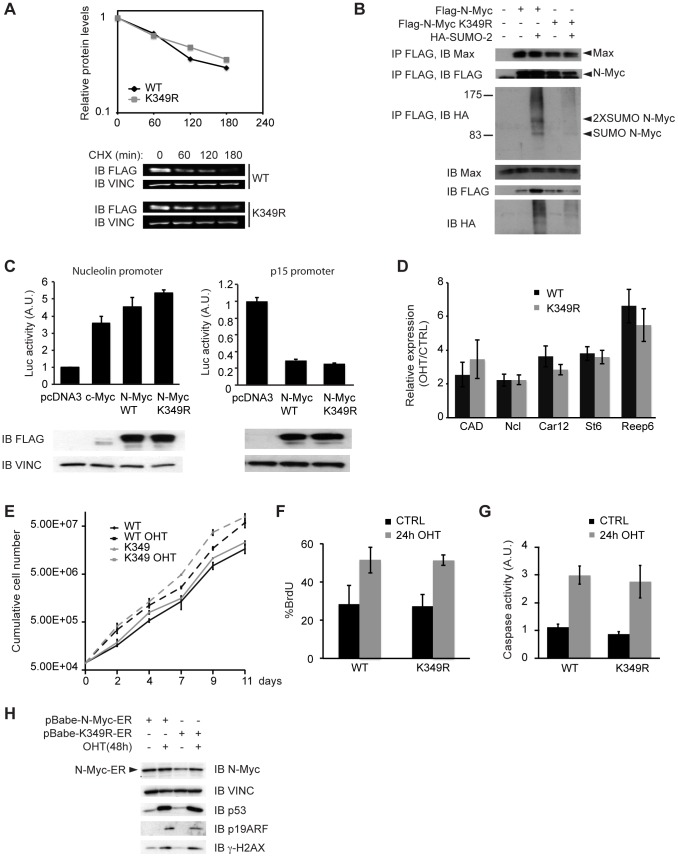
Figure 4. SUMOylation defective N-Myc mutant does not reveal critical differences respect to the wild type counterpart.
(A) U2OS cells transfected with Flag tagged N-Myc WT or K349R mutant were treated with CHX 50 µg/ml for the indicated times. Cells were then lysed and the levels of the Flag-N-Myc protein were measured by quantitative immunoblotting. The graph represents the means of three independent experiments. Immunoblot of one representative experiment is shown. It is noteworthy that the half-life of exogenous N-Myc measured here (ca. 110 min) is in range with that seen in analogous experiments for either N-Myc (157 min [27]) or c-Myc (97-100 min [54], [65]). (B) 293T cells were transfected with plasmids expressing the indicated proteins. Lysates were analyzed by immunoprecipitation and immunoblotting as indicated in Fig. 1, but in non-denaturing conditions (co-IP lysis buffer: see methods). (C) HeLa cells were transfected with the reporter plasmids pNuc-Luc (left panel) or p15-Luc (right panel) together with pRL-TK (as a normalizer) and expression plasmids for Flag-c-Myc, Flag-N-Myc WT or Flag-N-Myc K349R, as indicated. The transcriptional activity was measured with a Dual Luciferase Assay kit (Promega). The histograms represent the mean and s.d. of three independent experiments. The total levels of the indicated proteins were assessed by immunoblot. (D-H) Primary MEFs were infected with retroviral vectors coding for N-MycER™ WT or K349R and treated or not with 4-hydroxy-tamoxifen (OHT). (D) RT-PCR measurement of target mRNAs in OHT treated (48 h) versus control cells after normalization to the housekeeper RPPO. The histogram represents the mean and s.d. of three independent experiments. (E) Growth curves showing cumulative cell numbers for N-MycER™ WT or K349R MEFs treated or not with OHT for up to 11 days. The curves represent the mean and s.d. of three independent cell counts. (F) FACS analysis of BrdU incorporation (% of positive cells) after 24 h of OHT or control treatment. The histogram represents the mean and s.d. of three independent experiments. (G) Luminescence-based measurement of Caspase activity (Caspase-Glo 3/7, Promega) after 24 h of OHT or control treatment, the bars represent the mean and s.d. of three independent experiments. In neither of the quantitative assays used (panels A, C, D, E, F, G) was a statistically significant difference observed between the WT and K349R forms of N-Myc. (H) Immunoblot analysis of p53, ARF and γH2AX after 48 of OHT or control treatment.

