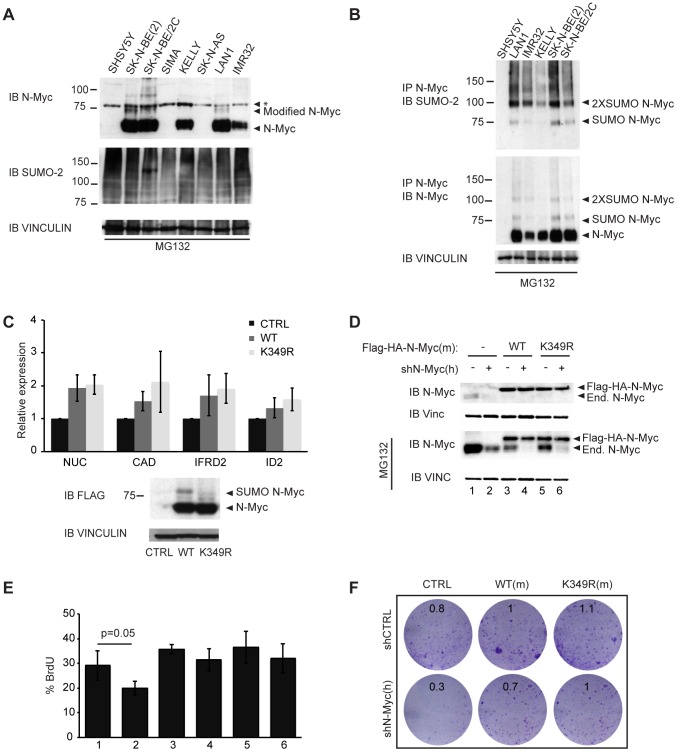
Figure 5. SUMOylation of N-Myc in neuroblastoma cells.
(A) Immunoblot analysis in denaturing conditions of different neuroblastoma cell lines after 6 h treatment with 10 µM MG132. (*): non-specific band. (B) Immunoprecipitation (IP) with anti-N-Myc antibodies in denaturing conditions and analysis by immunoblotting with the indicated antibodies. (C) SHSY5Y cells were infected with pQCXIP retroviral vectors expressing Flag-HA tagged WT or K349R N-Myc proteins and expression of selected mRNAs was measured by RT-PCR (after normalization to the housekeeper RPPO). The histogram represents the mean and s.d. of three independent experiments. The total levels of the indicated proteins were assessed by immunoblot. (D-F) SK-N-BE(2) cells were infected with pQCXIN empty vector, Flag-HA-N-Myc WT or K349R (mouse cDNA) and superinfected with pGIPZ-PURO shN-Myc or control shRNA. (D) Immunoblot analysis of the level of endogenous and Flag-HA tagged exogenous N-Myc protein in mock treated cells and cells treated with MG132 10 µM. (E) FACS analysis of BrdU incorporation (% of positive cells); the histogram represents the mean and s.d. of three independent experiments. The numbering of the samples corresponds to that in (D). In neither of the quantitative assays used (panels C, E) was a statistically significant difference observed between the WT and K349R forms of N-Myc. (F) Colony Assay. Cells were plated in 6-well plates, incubated for 7 days and stained with Crystal violet. Numbers in each plate indicate relative cell densities, as assessed by absorbance at 595 nm following solubilization of the dye with acetic acid.

