
Figure 1.
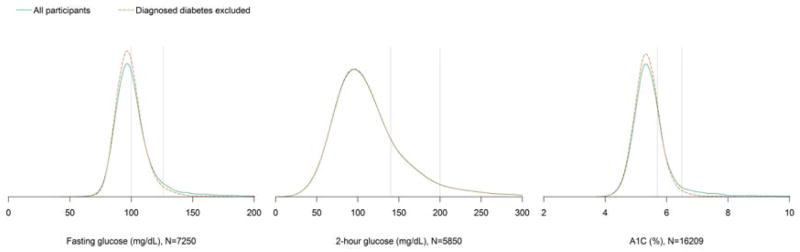
Kernel density plots of fasting plasma glucose, 2-hour plasma glucose, and A1C among the total population and after excluding participants with previously diagnosed diabetes. The vertical lines denote the American Diabetes Association cutpoints for prediabetes (5.7% [39 mmol/mol], 100 mg/dL, and 140 mg/dL) and diabetes (6.5% [48 mmol/mol], 126 mg/dL, and 200 mg/dL). Among participants without diagnosed diabetes, 38.9% had a fasting plasma glucose 100–125 mg/dL, 3.5% had a fasting plasma glucose ≥126 mg/dL, 27.4% had a 2-hour plasma glucose 140–199 mg/dL, 5.4% had a 2-hour plasma glucose ≥200 mg/dL, 20.9% had an A1C 5.7–6.4%, and 2.3% had an A1C ≥6.5%.