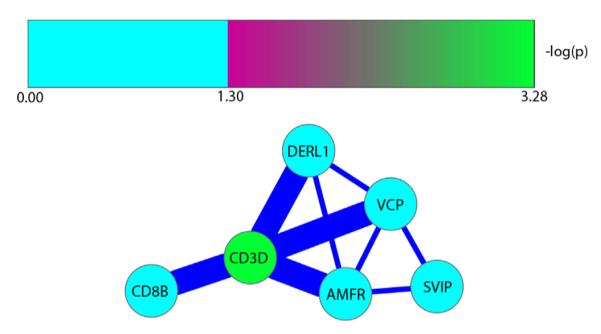
Fig. 1.

The most significant protein sub-network (p-value approximately 0) consists of 6 proteins. The central node is CD3D. Node colors represent the negative log p-value from the t-test between female s-allele carriers and non-s-allele carriers in the presence of cumulative stress after correction for multiple comparisons. Line thickness between nodes represents strength of interaction between proteins. Subnetwork enriched for pathway involved with cellular response to unfolded proteins and stress. (For interpretation of the references to color in this figure legend, the reader is referred to the web version of this article.)
