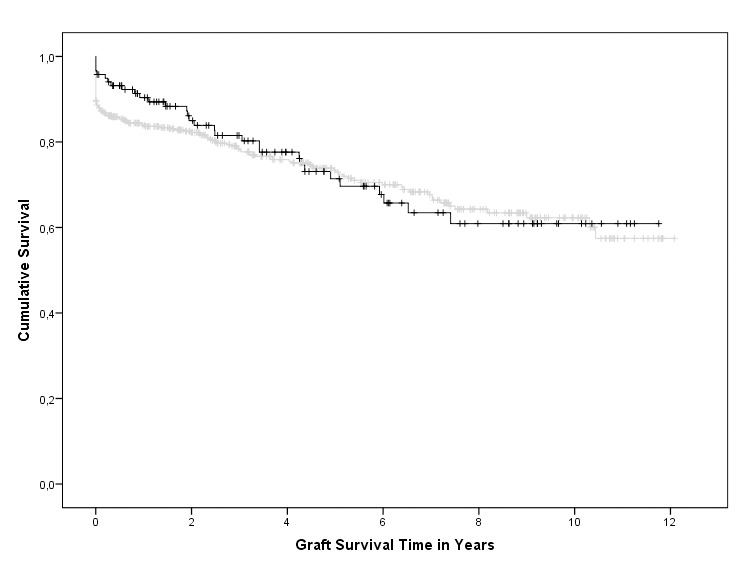
Figure 1. Kaplan-Meier survival, the black line corresponds to the group with urological complications and the grey line corresponds to the group without urological complications.

This curve is censored for death. No significant difference occurred between both groups (p = 0.707).
