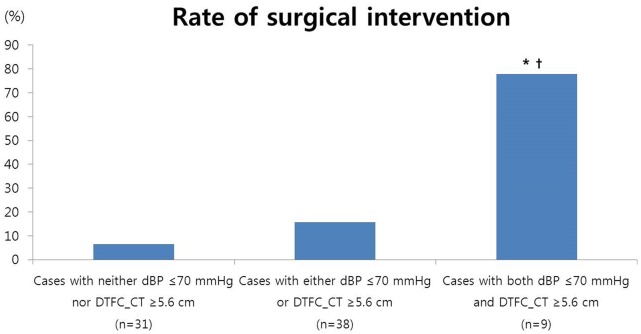
Figure 2. The rate of surgical intervention according to the absence or presence of risk factors.
*, p<0.05 compared to the cases with neither a dBP≤70 mmHg nor a DTFC_CT≥5.6 cm; †, p<0.05 compared to cases with either a dBP≤70 mmHg or a DTFC_CT≥5.6 cm. The proportions were compared with Fisher’s exact test.

