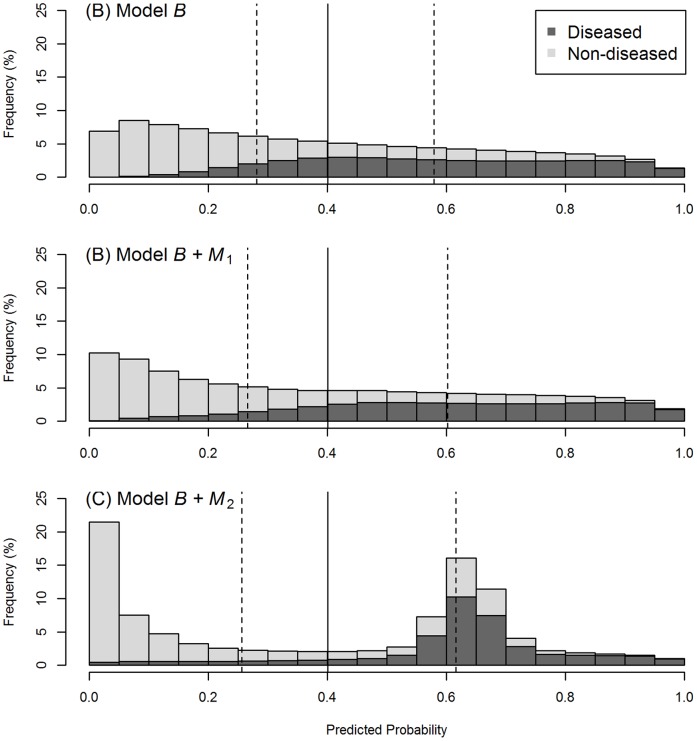
Figure 3. Distribution of the predicted probabilities for a baseline model (A), and the model with the new marker  added (B), or
  added (C).
The discrimination power of  is independent of the baseline score, and that of
  is concentrated in the gray zone of the baseline model. The solid vertical bar indicates the grand mean of the predicted probabilities, and the two dotted vertical bars, the means of the predicted probabilities for the diseased subjects and the non-diseased subjects, respectively.

