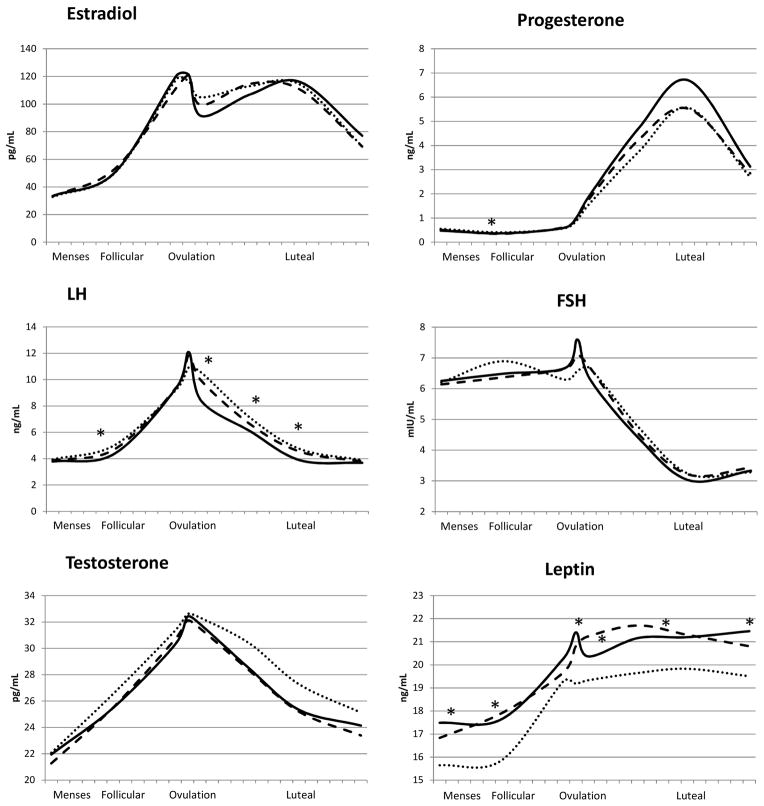
Figure 1.
Geometric mean hormone concentrations across a standardized 28-day menstrual cycle by average past-week physical activity within each cycle: lowest tertile (median=9, maximum =15 MET-h/week; solid line), middle tertile (median=24 MET-h/week; dashed line) and highest tertile (median=66, minimum=37 MET-h/week; dotted line).
PA= physical activity; LH= luteinizing hormone; FSH= follicle-stimulating hormone
* P-value < 0.05; geometric means were estimated and p-values were assessed using unadjusted linear mixed models. Significant differences were observed for progesterone (day 7: middle < highest tertile); LH (days 7, 14, 18, 22: lowest < highest tertile); and leptin (days 2, 7, 13, 18, 27: lowest > highest tertile; days 7, 14, 18: middle > highest tertile).

