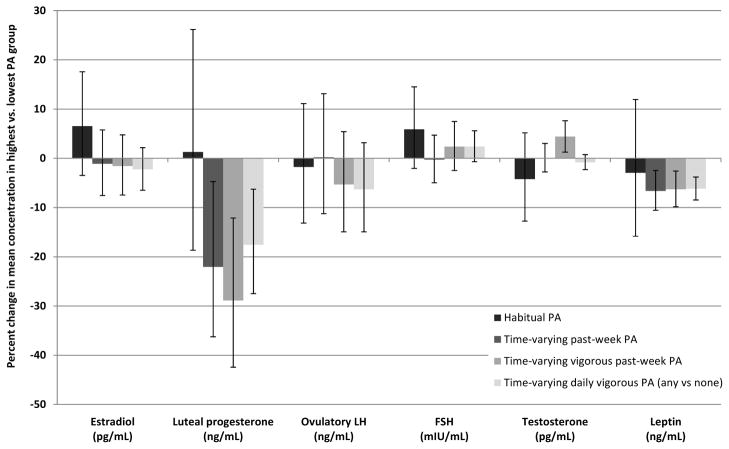
Figure 2.
The adjusted percent change in average hormone concentration for highest physical activity (PA) compared to lowest PA for four exposure definitions of PA: habitual PA, time-varying past-week PA, time-varying vigorous past-week PA and time-varying daily vigorous PA (any vs. none).
LH= luteinizing hormone; FSH= follicle stimulating hormone; MET= metabolic equivalent; PA= physical activity
The tertile cut-points were: 35.1 and 83.3 MET-h/week for habitual PA; 15.3 and 35.7 MET-h/week (on average) for time-varying past-week PA; and 1 and 15.5 MET-h/week (on average) for time-varying vigorous past-week PA. All analyses adjusted for baseline confounders; time-varying PA analyses were further adjusted for habitual PA and for concurrent hormones and caloric intake using inverse probability weights.

