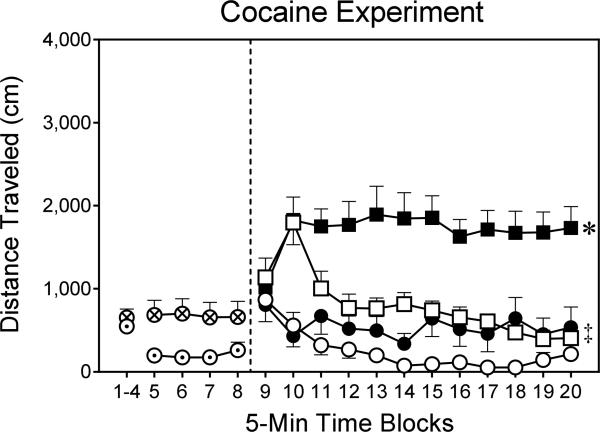
Fig. 6.
Mean distance traveled (±SEM) during the habituation (i.e., time blocks 1–8) and testing (i.e., time blocks 9–20) phases on PD 18 (n = 8 per group). DMSO pretreatment = ⊙; EEDQ pretreatment = ⊗; DMSO–Saline group = ○; DMSO–Cocaine group = □; EEDQ–Saline group = ●; EEDQ–Cocaine group = ■.
* Significantly different from all other groups (collapsed across time blocks 9–20).
‡ Significantly different from the DMSO-Saline group (collapsed across time blocks 9–20).

