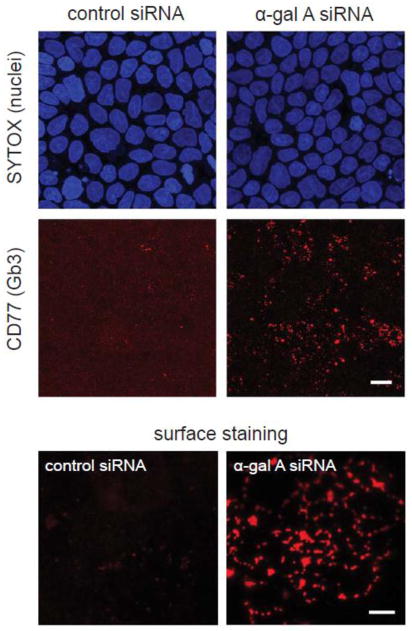
Figure 2. α-gal A siRNA silencing increases cellular levels of Gb3.
(Top) Filter-grown MDCK cells transfected with control (left panel) and α-gal A siRNA (right panel) for seven days were processed for indirect immunofluorescence using anti-CD77 antibody to detect Gb3 Gb3 and imaged by epifluorescence microscopy. SYTOX Green Nucleic Acid Stain was used to visualize nuclei. Scale bar: 10 μm (Bottom) Surface staining of CD77/Gb3 in non-permeabilized MDCK control cells (left) and α-gal A siRNA silenced cells (right). Maximum projections of five optical sections taken at the apical surface are shown. Scale bar: 5 μm.

