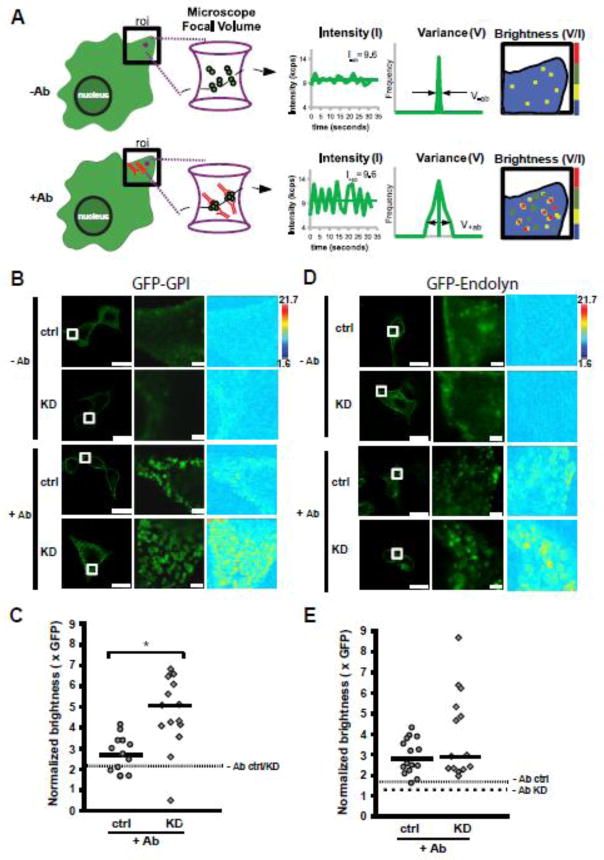
Figure 5. α-gal A silencing alters antibody induced-clustering of a lipid raft associated protein.
Schematic of the theory of number and brightness (N&B) analysis. Left: depiction of cell surface expression of GFP-GPI protein in the absence (−Ab), or presence (+Ab) of anti-GFP antibody (red). The magenta circle in the region of interest (roi) represents the focal volume of the microscope. The magenta hourglass is an expanded view of the focal volume with a representation of GFP-GPI clusters (membrane not shown for clarity) diffusing in the −Ab or +Ab conditions. Center: In this example, the total concentration in the roi before and after Ab addition is similar, giving rise to the same average fluorescence intensity (k). When antibody is added to induce clustering, the same average fluorescence intensity is now redistributed into a few oligomeric species within the focal volume, which causes a dramatic increase in the signal variance (σ) as the large oligomers diffuse through the focal volume. The ratio of variance to intensity is termed molecular brightness (brightness) and provides information on the oligomeric status of a protein when compared to the monomeric fluorescent probe. Right: Depiction of brightness map for the roi in the −Ab and +Ab conditions with cool and warm colors representing less and more clustering, respectively. (B) Control or α-gal A silenced (KD) cells expressing GFP-GPI in the absence or presence of anti-GFP antibody. Left panels: Fluorescence images showing control and or α-gal A silenced cells before (−Ab), or 10 min after addition of anti-GFP antibody (+Ab); scale bar: 20 μm. Middle panels: higher magnification of the boxed region where N&B measurements were acquired; scale bar: 2 μm. Right panels: map of molecular brightness for the inset regions shown in the fluorescence images; heat map scale bar = normalized molecular brightness per pixel (e.g. 2 = 2 GFP molecules per cluster). (C) Scatter plot of normalized molecular brightness values for control and or α-gal A silenced cells (n=13 and n=15, respectively, from two experiments). The dotted line represents the average normalized molecular brightness (~2.2) for control and α-gal A silenced cells in the absence of antibody. *p < 0.005 by unpaired t-test. (D) Control or α-gal A silenced (KD) cells expressing GFP-endolyn in the absence or presence of anti-GFP antibody. Image layouts same as in panel B. (E) Scatter plot of normalized molecular brightness values for GFP-endolyn in control or α-gal A silenced cells (n=16 and n=14, respectively, from two experiments). The fine dotted line represents the average normalized molecular brightness for control and the coarse dotted line for α-gal A silenced cells in the absence of antibody (1.65 and 1.27, respectively).

