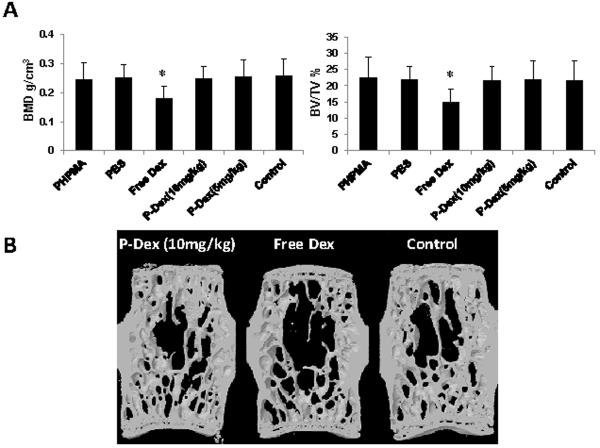
Figure 11.
Skeleton side effect evaluation analyzed by micro-CT. A: In the lumbar vertebral body, there were significant lower BMD and BV/TV in free Dex treated group when compared with all other groups (P < 0.05). B: Representative 3D images of one lumbar vertebral body from P-Dex (10 mg/kg), free Dex and control groups. It is obvious that there is less trabecular bone and trabecular connectivity in the free Dex treated group.

