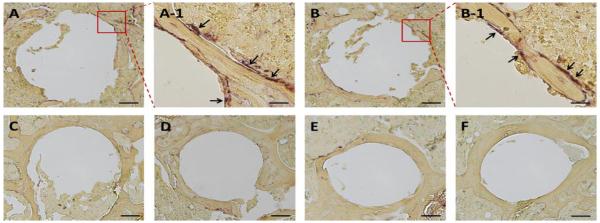
Figure 5.

Representative TRAP staining images of the peri-implant bone. A: PHPMA treated group; B: PBS treated group; C: Free Dex treated group; D: P-Dex (10 mg/kg) treated group; E: P-Dex (5 mg/kg) treated group; F: Control without PMMA particle challenge; Bars = 100 μm; A-1 and B-1 represented the enlarged area in A and B; Bars = 20 μm. There were multiple TRAP-positive cells present on the bone surfaces in A-1 and B-1 as indicated by arrows.
