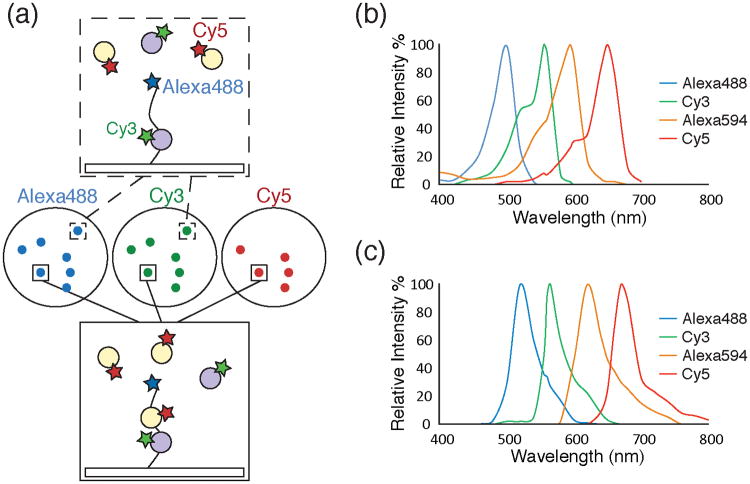
Figure 1.
a) Schematic of a single molecule colocalization experiment. Images (center circles) can be acquired using three different excitation wavelengths (Alexa488™, 488nm, blue; Cy3, 532nm, green; Cy5, 633nm, red). The images show fluorescently labeled molecules as diffraction limited spots. A surface tethered molecule (top box) labeled with Alexa488™ interacting with a Cy3-labeled partner (grey circle, green star) will appear as colocalized spots in the blue and green images. Another surface tethered molecule (bottom box) interacting with both Cy3- and Cy5-labeled partners (the latter represented by orange circles with red stars) will appear as colocalized spots in the blue, green, and red images. b) A plot of excitation spectra for selected organic fluorophores useful for single molecule colocalization experiments.61 c) A plot of emission spectra for the same fluorophores as in 1b.61 The fluorophores depicted in 1b and 1c show well separated fluorescence excitation and emission spectra suitable for multi-wavelength colocalization experiments.

