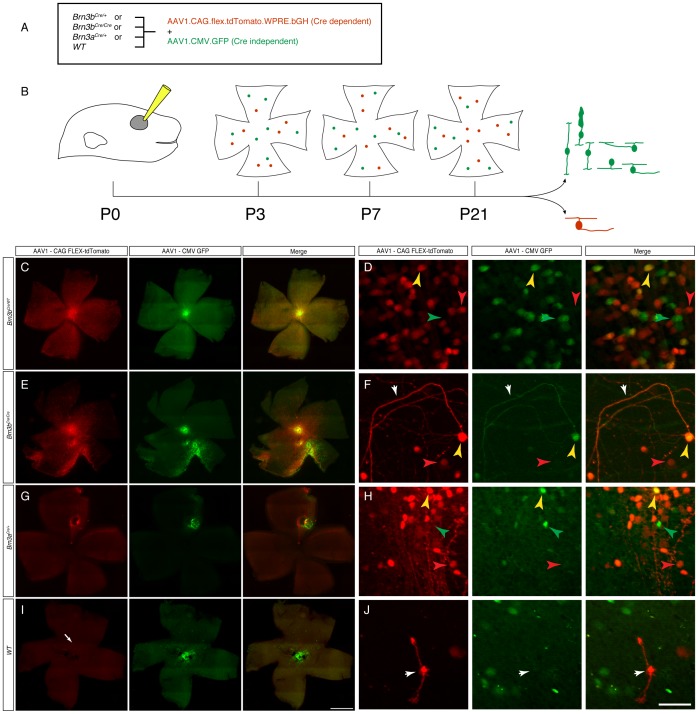
Figure 5. Retinal expression of viral Cre dependent reporters after postnatal day 0.5 (P0) intraocular infection.
A, Genetic backgrounds and viruses used. Brn3bCre/+, Brn3bCre/Cre, Brn3aCre/+, or Brn3b+/+ littermate pups were infected with a combination of Cre dependent AAV1.CAG.flex.tdTomato.WPRE.bGH virus and a constitutively expressed, Cre independent AAV1.CAG.GFP virus. B, Experimental time lines. Eyes of P0 pups were injected, and retinas were analyzed at either P3, P7 or after P21. Cells infected with the Cre independent virus should appear green, while Cre positive cells infected with the Cre dependent virus should appear red. Results from this experiment are shown in figures 5, 6 and 7. C, E, G, and I, flat mount preparations of adult retinas of indicated genotypes, demonstrating extensive expression of (Cre dependent) tdTomato red staining in Brn3bCre/+ (n = 6), Brn3bCre/Cre (n = 4) or Brn3aCre/+ (n = 12) retinas, and only very isolated expression in Cre negative, WT retinas (n = 3 for the Brnb litters and n = 4 for the Brn3a litters). Note that in some cases, red and green fluorescence are evenly distributed over the entire retina, while in others there is an apparent segregation of red and green fluorescence, most likely by subretinal distribution of the Cre independent, AAV1.CAG.GFP virus (see figure 6). White arrow in I points at one of the few red cells labeled in the WT retinas, shown enlarged in the inset in J. D, F, H, and J represent higher magnifications of retinas shown in C, E, G, and J respectively. Left panels are tdTomato, red fluorescence, middle panels are GFP, green fluorescence, and right panels are merge channels. In all panels, red arrowheads point at tdTomato positive, green arrowheads at GFP positive, and yellow arrowheads at double positive cells. White arrowhead in F labels wandering axons characteristic of Brn3b null (Brn3bCre/Cre) retinas. White arrowhead in J points at the tdTomato positive cell in I, most likely a Müller Glia. Scale bars in I = 1 mm and J = 50 µm.

