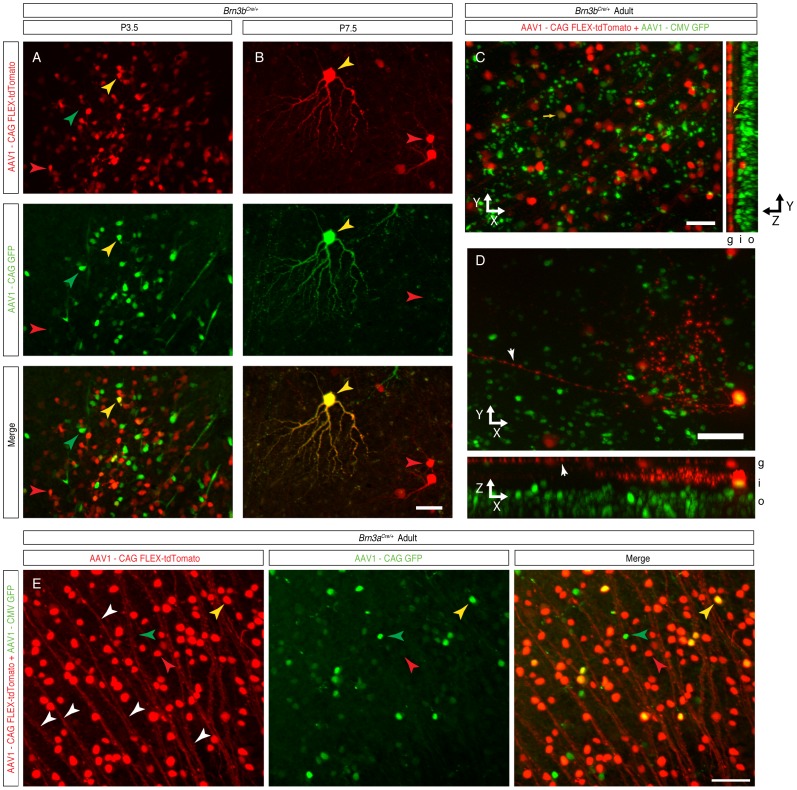
Figure 6. AAV1-FLEX-tdTomato infection at P0 results in RGC specific tdTomato expression, which is already detectable at P3.5 and P7.5.
Retina samples are from P3.5 (A), P7.5 (B) pups or adults (C–E). Panels in A, B are tdTomato (top), GFP (middle), and merged (bottom) images. Panels A-D are from Brn3bCre/+, and E from from Brn3aCre/+ mice, infected at P0 after the protocol described in figure 5 A, B. Red, green and yellow arrowheads point at examples of red and green single positive or double positive cells. Note that the dendritic arbor of the double positive cell in B is clearly visible in both red and green channels. C, Projections along the z direction (left) and x direction (right) of a stack from a densely labeled Brn3bCre/+ retina, showing an overwhelming majority of red fluorescent cell bodies stratified in the GCL (g) layer, whereas abundant numbers of green fluorescent bodies are seen throughout the Inner and Outer Nuclear Layer (i and o). D, Projections along the z direction (top) and y direction (bottom) of a stack from a sparsely infected Brn3bCre/+ retina showing a displaced RGC, with its axon (white arrowheads) and dendritic arbor, seen both from the flat mount and transversal perspective. E, z projection of a stack from a densely labeled Brn3aCre/+ retina, showing single and double labeled cell bodies, and tdTomato labeled RGC axons (white arrowheads). Scale bars in B, C, D and E = 50 µm.

