
Figure 5. Receiver Operating Characteristic (ROC) curves.
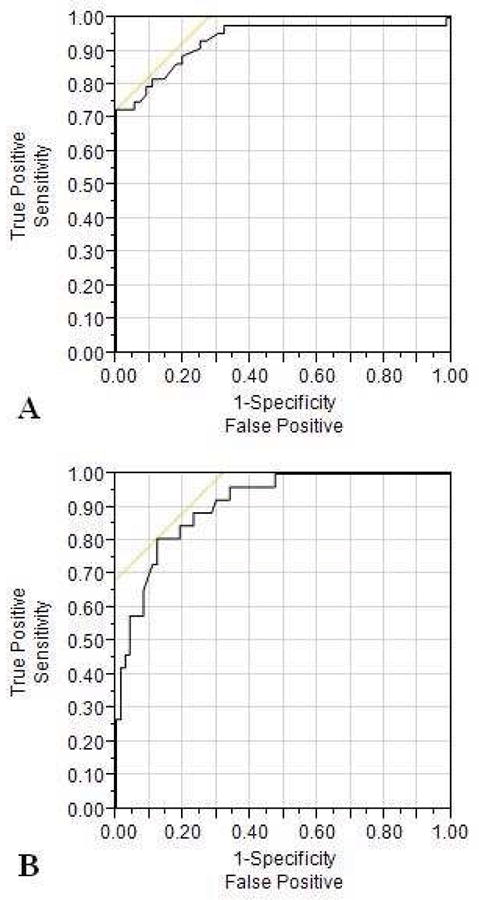
Receiver operative curves (ROC) showing the ability of ΔPE to predict RV hypertension using two thresholds: (A) RVSP ≥1/2SBP, AUC 0.93 (95% CI 0.85–0.97, p<0.001) and (B) RVSP ≥2/3SBP, AUC 0.91 (95% CI 0.84–0.96, p<0.001). The yellow line is drawn at a 45 degree angle tangent to the ROC curve. This marks the point (criterion value) at which false negatives and false positives have similar costs.