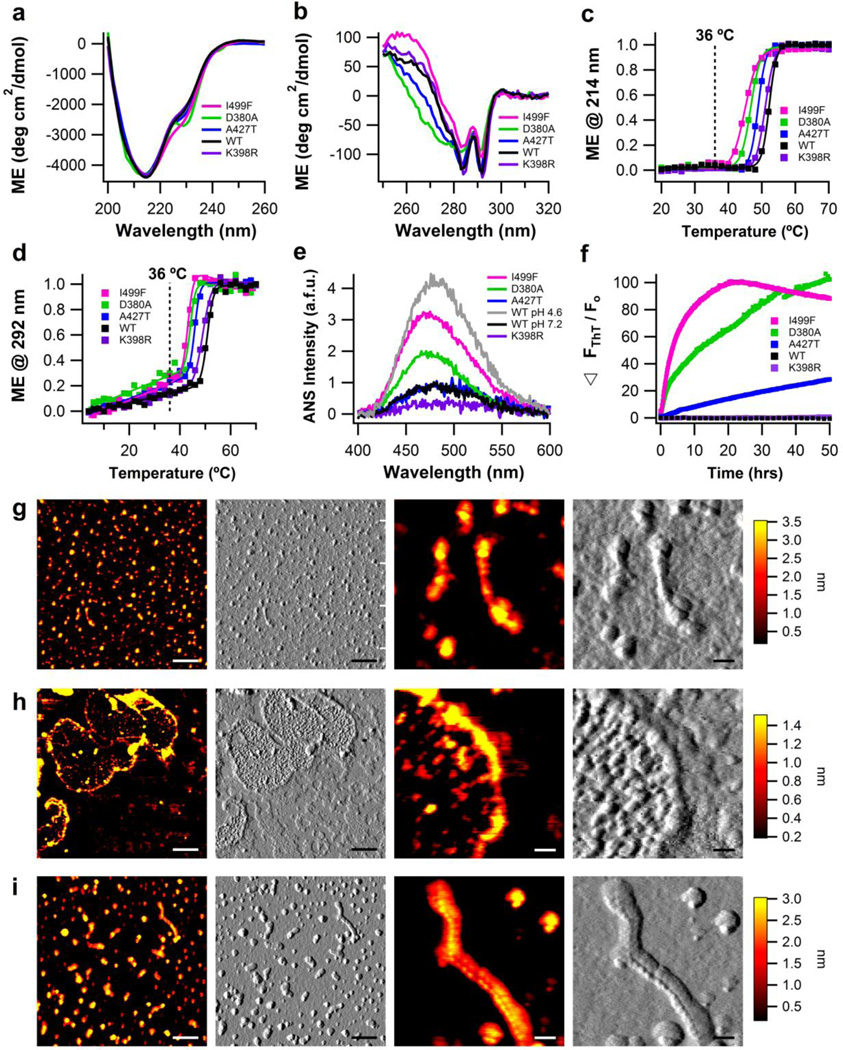
Figure 4. Biophysical characterization of myoc-OLF variants K398R (SNP), D380A, A427T, and I499F (disease-causing) in physiological buffers.
(a) Secondary structure measured by far-UV CD. (b) Tertiary structure measured by near-UV CD. (c) Thermal unfolding of secondary structure monitored by CD at 214 nm. Fit is sigmoidal. (d) Thermal unfolding of tertiary structure monitored by CD at 292 nm. Fit is linear plus sigmoidal. For (a)-(d), wild-type myoc-OLF at neutral pH with 200 mM NaCl is overlayed for comparison. (e) ANS fluorescence as a function of pH, with overlay of wild-type myoc-OLF at pH 7.2/200 mM NaCl and 4.6/200mM NaCl. (f) ThT fluorescence at 36 °C monitored for 50 hours. (g) End-point morphologies seen for myoc-OLF(A427T) are fibrils and oligomers. (h) Deposits of myoc-OLF(D380A) appear as curvilinear and circular fibrils enclosing smaller globular aggregates. (i) Morphologies seen for myoc-OLF(I499F) are fibrils and oligomers, similar to myoc-OLF(A427T). For (g)-(i), two left panels scale bar = 300nm and two right panels scale bar = 50nm.

