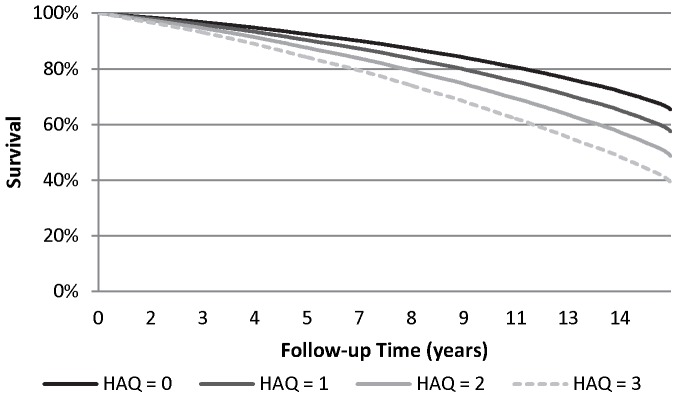
Figure 3. Survival curves for the typical osteoarthritis (OA) cohort participant* by level of walking disability (HAQ walking score) at baseline assessment.

*typical defined as the mean or most common value for variables in the final model for all-cause death.
