
Figure 5.
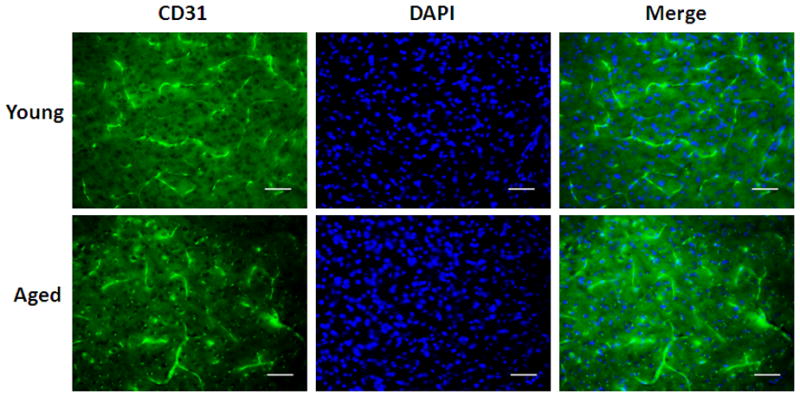
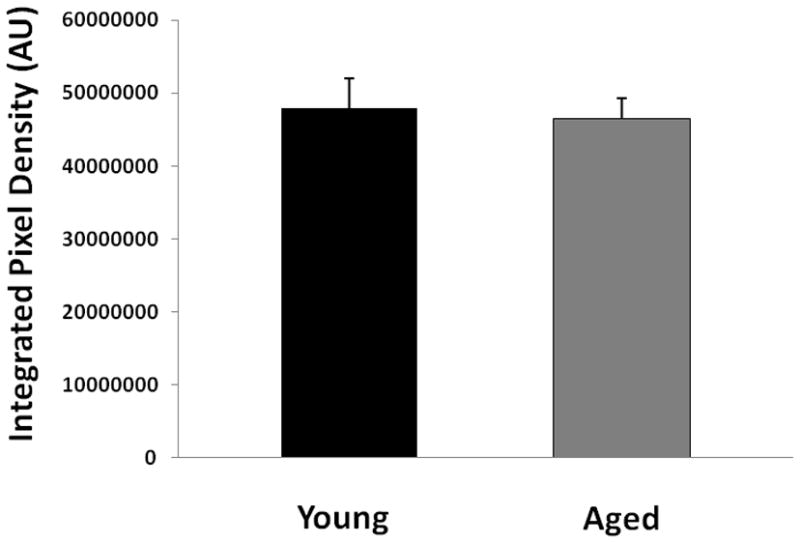
CD31 staining of young vs. aged mice 24 hours after MCAO. (A) Representative FITC-dextran staining pictures (20x). Scale bar = 50 μm. (B) Integrated vascular density in young vs. aged mouse brain sections 24 hours after MCAO. There was no significant difference in the integrated pixel density of young vs. aged mice.