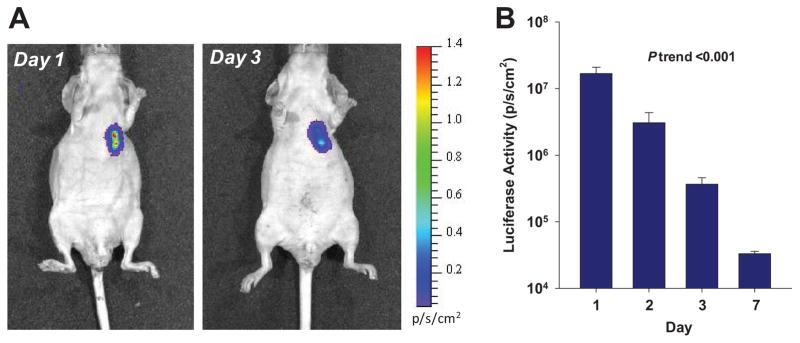
Figure 1.

(A) Examples of optical imaging of luciferase-transfected MAPC at day 1 and 3 illustrating location and decay of luciferase signal. (B) Mean (±SD) luciferase signal on a logarithmic scale from a region-of-interest placed over the chest. ANOVA p<0.01.
