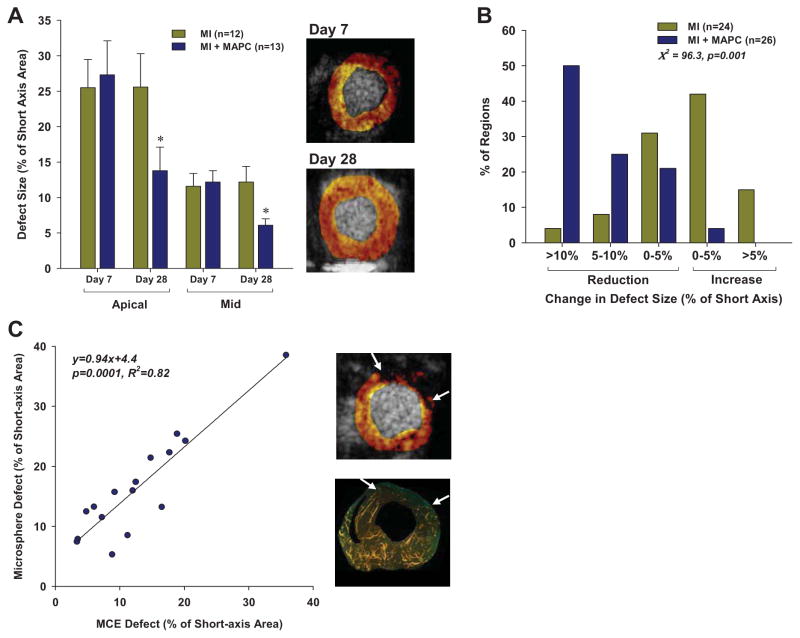
Figure 2.
(A) Mean (±SEM) perfusion defect size by MCE expressed as a percentage of the short-axis area in the apical and mid-ventricular regions at day 7 and 28. *p<0.001 vs day 7 and p<0.05 versus MI group. Examples of the mid-ventricular defect area on MCE at day 7 and 28 from the mouse with the largest change in defect size are illustrated at the right. (B) Histogram illustrating the percent of short-axis slices that underwent different patterns of defect area change between day 7 and 28. Data for apical and mid-ventricular slices have been combined. (C) Relation between defect size (arrows) measured on MCE and on fluorescent microsphere examination at day 28. An example of defect size for each technique from a single animal is illustrated at the right.

