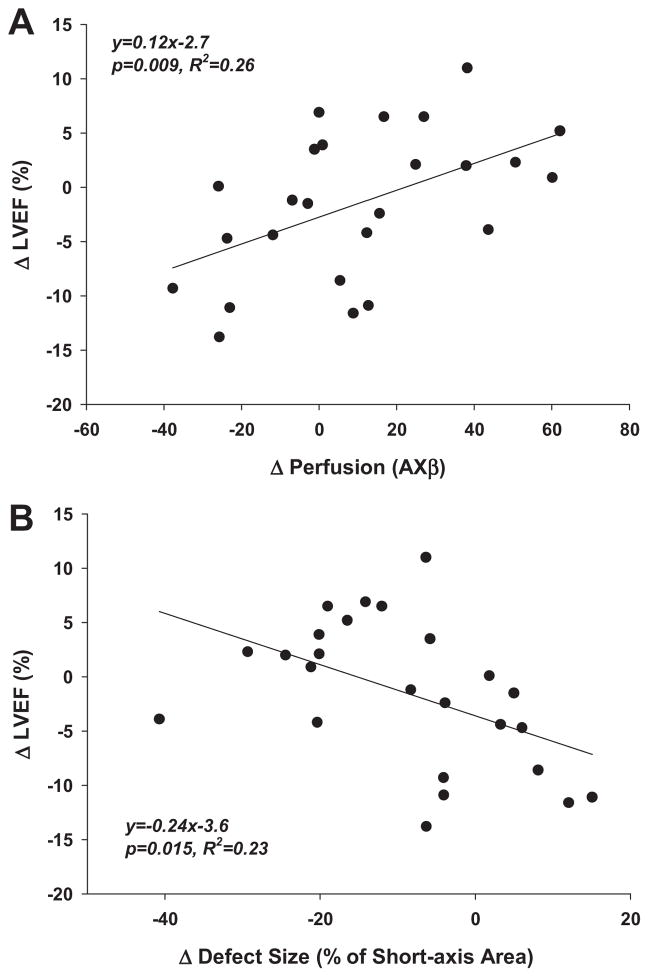
Figure 5.
(A) Correlation between change in MCE-derived perfusion for the entire short axis from day 7 to 28 and absolute change in LVEF. Perfusion data are averaged from the apical and mid-ventricular planes. (B) Correlation between change in MCE-derived perfusion defect size from day 7 to 28 and absolute change in LVEF. Defect size data represent summed area change from the apical and mid-ventricular planes.

