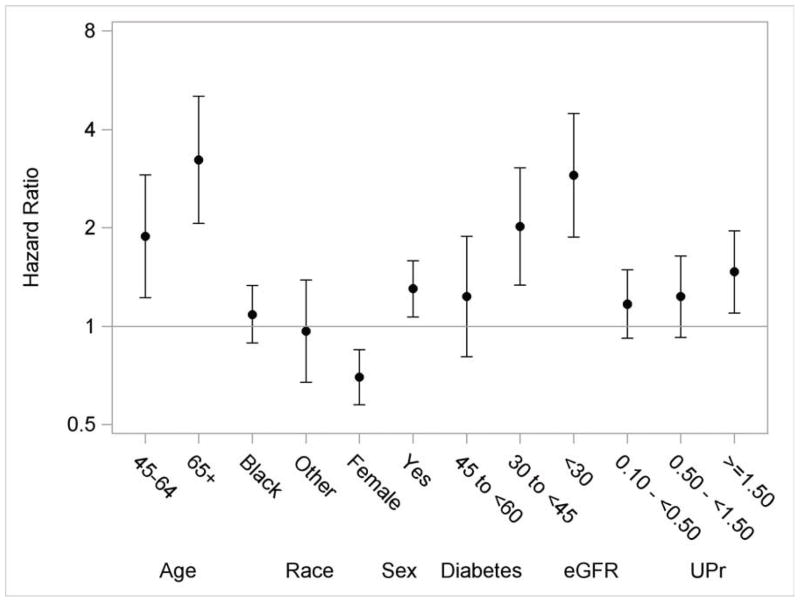
Figure 3.
Multivariable adjusted hazard ratios and 95% confidence intervals for death. The reference groups are 21–44 years for age, white for race and male for gender. Y-axis was plotted in natural log scale with labels in the original scale. Models additionally included ankle-brachial index, uric acid, history of CVD, BMI, hypertension, hemoglobin, education and smoking status.

