
Figure 4.
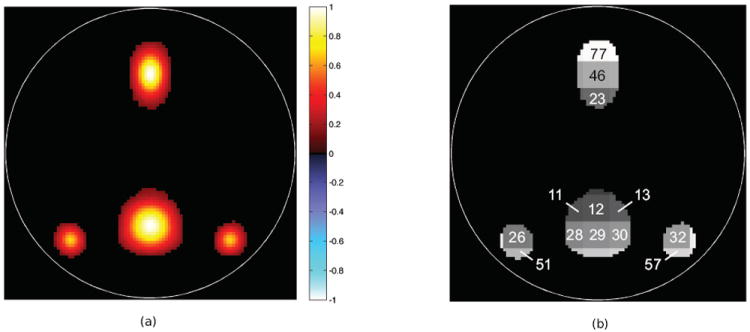
Mean spatial map of the default mode component and indexes of overlapping square regions. This figure shows (a) the default mode component’s thresholded mean spatial map across subjects and (b) the square regions that overlap with this mean map and the indexes of the overlapping regions.