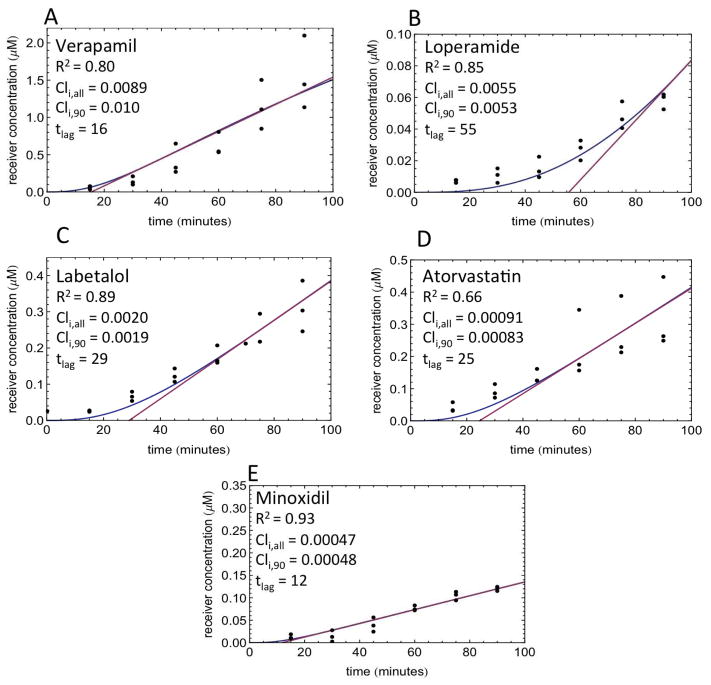
Figure 5. Experimental lag times.
Receiver concentrations in direction as a function of time are depicted. Experiments were conducted in MDCK cells at 20μM drug concentration in triplicate, and data points are depicted as closed circles. Data were collected for A) verapamil, B) loperamide, C) labetalol, D) atorvastatin, and E) minoxidil. The 5C model-predicted concentration – time profile is depicted with a blue line. The tangent at the inflection point of the logistic curve to calculate lag time (tlag) is depicted with a pink line. CLi,all: CLi predicted with the entire time course dataset; CLi,90: CLi predicted with the single point (90 min) data points.

