
Figure 8.
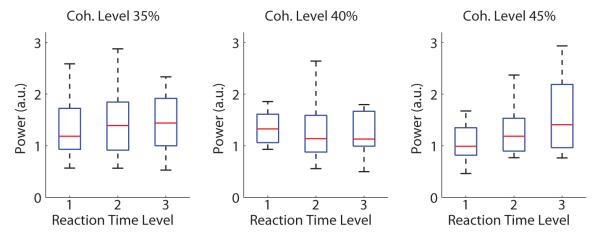
Analysis of pre-stimulus α power using reaction time (RT). Trials were sorted by reaction times in ascending order and divided at 3-quantiles (tertiles). Significant difference on pre-stimulus α power was only found between long RT group and short RT group for easiest trials (45% coherence level). Data for each group is displayed as a box plot–additional explanation for plots is given in Figure 5.