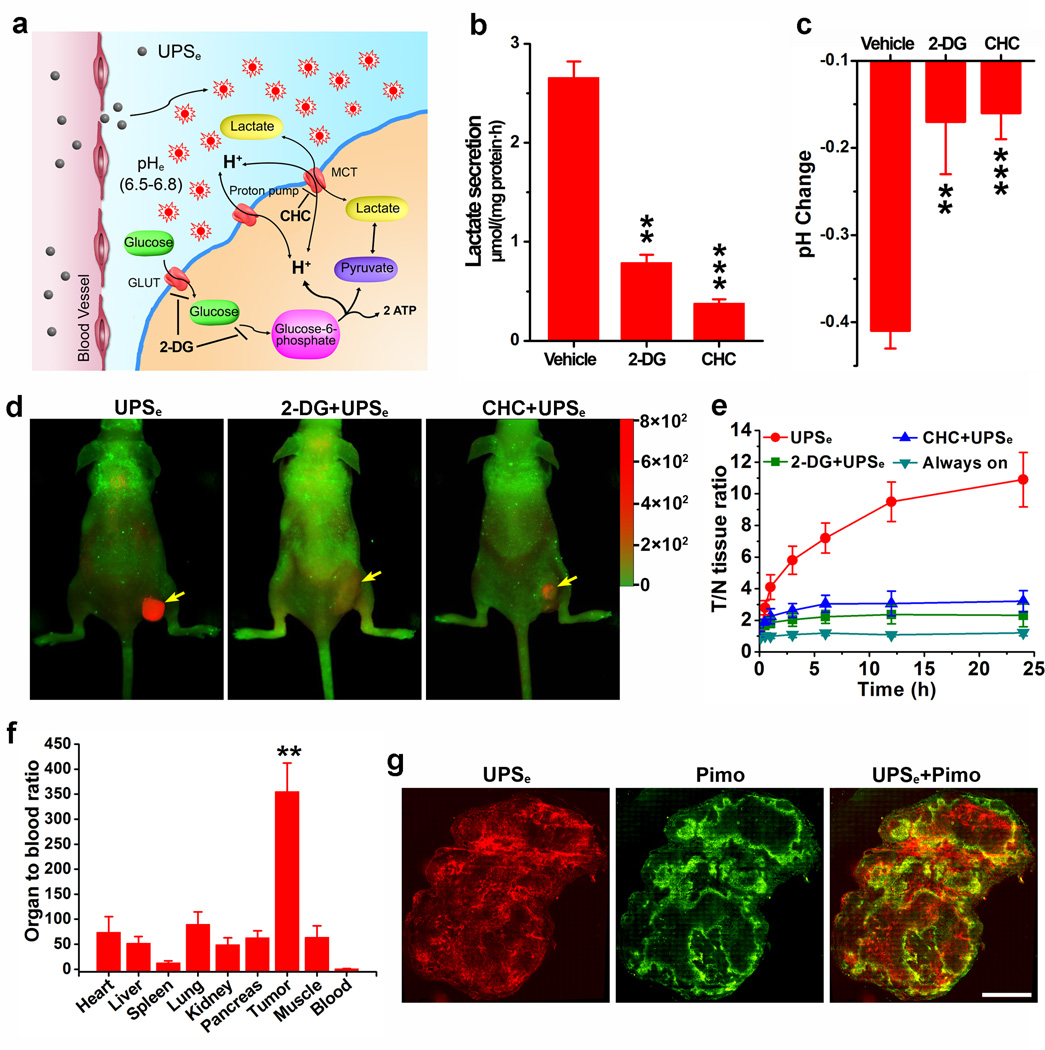
Figure 3. UPSe nanoprobes can specifically image acidic tumor pHe.
a, Aerobic glycolysis converts glucose to lactate in cancer cells. 2-DG and CHC are metabolic inhibitors for glucose uptake and lactic acid secretion, respectively. b, Effect of 2-DG or CHC on the rate of lactic acid secretion in A549 cells. c, Acidification of A549 cell culture medium in the presence of 2-DG or CHC after 6 h incubation. *P < 0.05, **P < 0.01, ***P < 0.001, compared with vehicle group. d, Overlaid fluorescent images of A549 tumor-bearing mice at 24 h postinjection of UPSe nanoprobes (10 mg/kg). In the control groups, 2-DG (250 mg/kg) or CHC (250 mg/kg) was injected 12 h before UPSe nanoprobe administration. Cy5.5 (red) and autofluorescence (green) are separately shown in the composite images. Yellow arrows indicate the tumor location. e, NIR fluorescence intensity ratio between tumor and normal tissues (T/N ratio) as a function of time after UPSe injection. Data are presented as mean ± s.d. (n = 4). f, Organ to blood ratios (see data in Table S5) 24 h post-injection of UPSe (n = 4). A549 tumor has 355-fold of signal amplification over blood by UPSe. **P < 0.01, compared with other organs. g, Hypoxia bands qualitatively correlate with activation pattern of UPSe in A549 tumor xenograft. Whole mount images of tumor slices stained for hypoxia (green). All images were obtained from the adjacent sections at ×200 magnification. Scale bar is 2 mm.

